
A survey of 415 people carried out in the two weeks after the Budget announcement finds that satisfied respondents outnumber dissatisfied ones by two to one (48% to 24%). Pensions and social benefits earned the most praise and transport and infrastructure the most criticism, while satisfaction was markedly lower among 18–29-year-olds.

A positive response, but nearly three in ten gave no verdict
A survey of 415 respondents conducted over the two weeks immediately following the presentation of Malta’s Budget 2027 on 26 October 2026 offers a snapshot of the public’s initial reaction to the Government’s measures. Interviews were carried out by telephone and online, and respondents were asked about both their overall satisfaction and the specific policy areas they viewed positively or negatively.
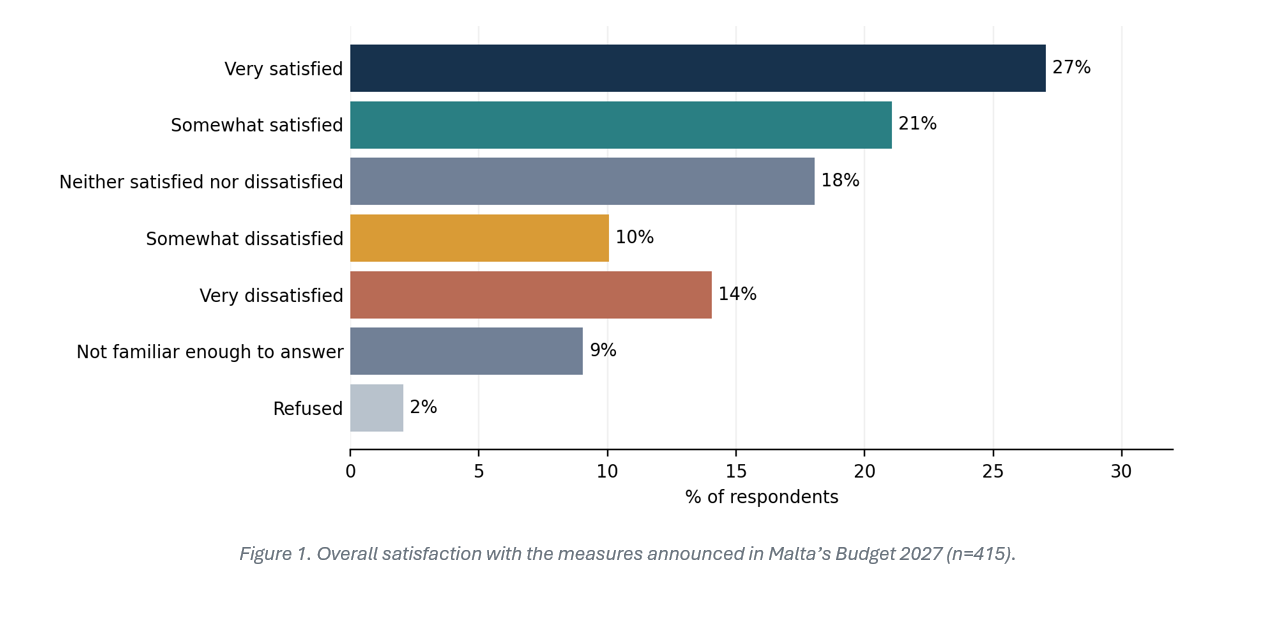
Almost half of respondents (48%) said they were satisfied with the Budget: 27% were very satisfied and 21% somewhat satisfied. That is twice the share who were dissatisfied (24%), made up of 14% very dissatisfied and 10% somewhat dissatisfied. A further 18% were neither satisfied nor dissatisfied, 9% said they were not familiar enough with the Budget to answer and 2% declined to respond.
Young adults are the least satisfied
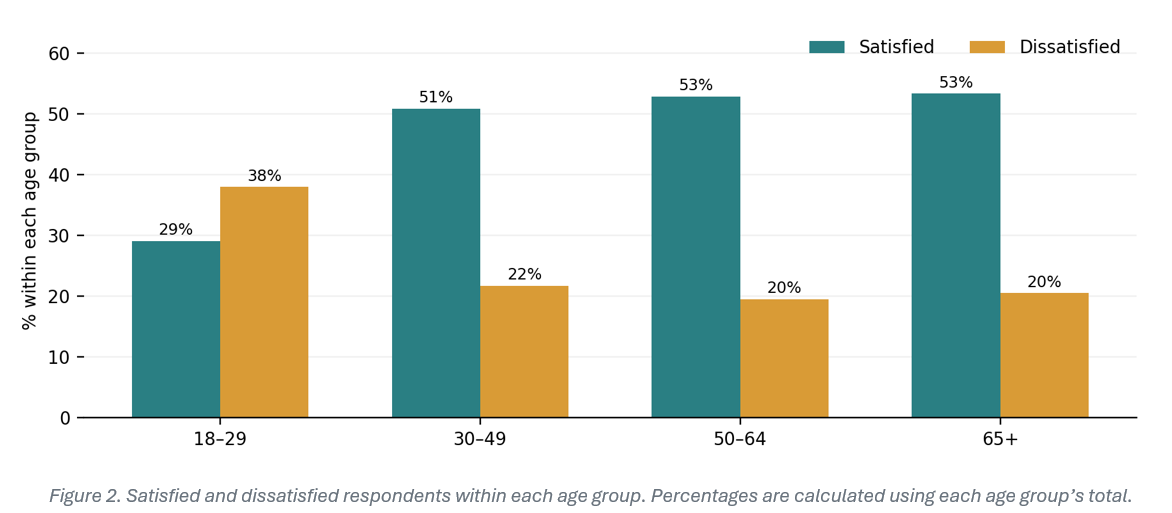
The age breakdown points to a notable difference between younger and older respondents. Among those aged 18–29, 29% were satisfied with the Budget, while 38% were dissatisfied – the only age group in which dissatisfaction exceeded satisfaction. This group accounts for 19% of the sample, or roughly 80 respondents, so its results should be read with caution.
Satisfaction was considerably higher among respondents aged 30–49 (51%), 50–64 (53%) and 65 and over (53%), where dissatisfaction stood at between 20% and 22%. The pattern suggests that the Budget was received less favourably by younger adults in this sample. The survey does not, however, establish why this difference exists; it may reflect differing priorities or expectations, which would require further research to explore.
Differences by gender were comparatively small and should not be over-interpreted: 49% of women and 46% of men said they were satisfied, while 23% of women and 25% of men were dissatisfied.
Pensions and social benefits lead the satisfaction list
Asked which areas of the Budget they were satisfied with, respondents most often selected pensions and social benefits (118 of the 415 surveyed). Cost of living and taxation followed (82), then healthcare (65) and education (55). The Super Bonus, a €1,000 payment for workers (48), measures relating to third-country (non-EU) nationals (47), and business and economic growth (44) also featured among the more frequently selected areas, while 39 respondents selected transport and infrastructure.
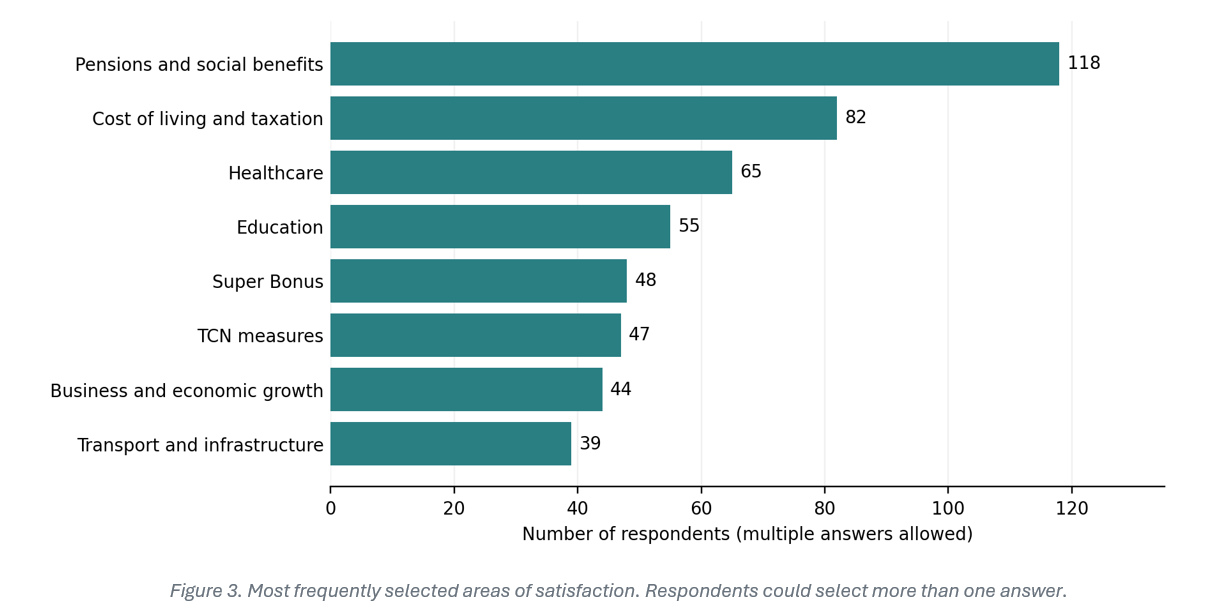
The results indicate that social protection and measures connected with household finances were prominent among the areas attracting positive recognition. Only 32 respondents named pensions and social benefits as a source of dissatisfaction, against 118 who named them as a source of satisfaction. At the same time, 76 respondents selected ‘none of the above’, while 63 said they were not sure. These responses are important context: overall satisfaction does not necessarily mean that respondents could identify a specific measure they welcomed.
Satisfied overall, but with specific gripes
Indeed, about 60% named at least one area of dissatisfaction, yet only 24% (about 100 people) were dissatisfied overall; similarly, about 276 named an area of satisfaction against about 199 satisfied overall. This is plausible (people can be satisfied overall and still have gripes).
Transport and infrastructure top the dissatisfaction list
Transport and infrastructure were the most frequently selected area of dissatisfaction, named by 94 respondents. Cost of living and taxation came next (74), followed by measures relating to third-country nationals (58), environment and energy (55), and housing (49). Healthcare and employment and wages were each named by 41 respondents.
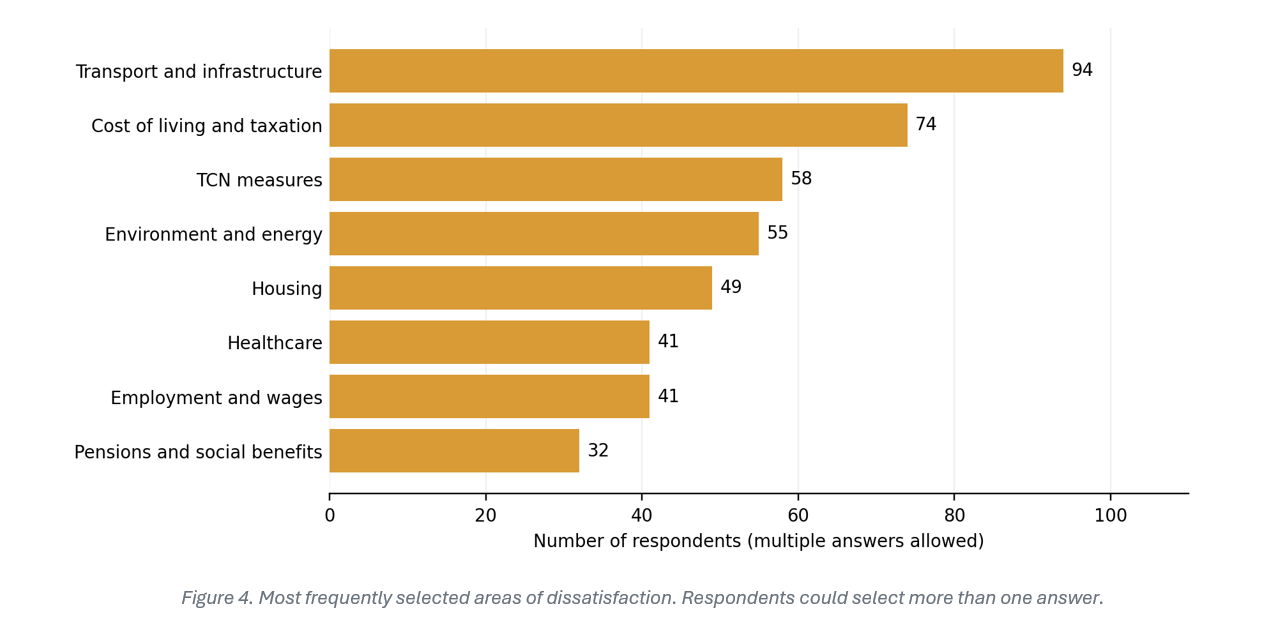
The prominence of transport and infrastructure stands out: for every respondent who named it as an area of satisfaction (39), more than two named it as an area of dissatisfaction (94). Cost of living and taxation, by contrast, divided opinion almost evenly (82 satisfied, 74 dissatisfied), indicating that it remains a central issue in how people judge the Budget. Measures relating to third-country nationals also drew more criticism (58) than praise (47).
Not all respondents identified an area of dissatisfaction: 89 selected ‘none of the above’, while 78 said they were not sure. As with the satisfaction question, respondents could select multiple answers, so the category counts are not mutually exclusive.
What the findings tell us
Taken together, the findings show that satisfied respondents outnumbered dissatisfied ones by two to one, but that opinion varied sharply by policy area. Pensions and social benefits attracted the highest number of positive responses and transport and infrastructure the highest number of negative ones; cost of living and taxation divided opinion almost evenly, while measures relating to third-country nationals drew more criticism than praise.
The lower satisfaction recorded among 18–29-year-olds is another notable finding. It points to a difference in sentiment by age, although the survey cannot determine the reasons behind it and the group is small (roughly 80 respondents). Further research could explore which issues matter most to younger adults and what they expect from future budgetary measures.
The results should be read as a snapshot of public opinion in the two weeks immediately after the Budget announcement. They capture initial reactions at that point in time rather than longer-term assessments of how the measures affect people’s lives.
________________________________________________________________________________
About the research
The survey involved 415 respondents and was conducted over a two-week period immediately following the presentation of Malta’s Budget 2027. A mixed-methodology approach was used, combining telephone and online interviews. The sample comprised 49% women and 51% men. By age, 19% of respondents were 18–29, 39% were 30–49, and 21% each were aged 50–64 and 65 or over.
Questions about specific areas of satisfaction and dissatisfaction allowed multiple answers. The figures for these questions therefore represent selections, not mutually exclusive groups. Percentages are rounded and may not sum to 100%.
A random sampling method was adopted, the margin for 415 respondents is about ±4.8 points at 95% confidence and for subgroups it is wider.
About the researcher
Caroline Pavia Sciortino is Director at EMCS Advisory Ltd and has more than 20 years’ experience in the research industry. Her work spans market research and public opinion studies, including the design, management and delivery of research projects across a range of sectors. Caroline led the research into public perceptions of Malta’s Budget 2027.