The covid 19 pandemic has been with us for over two years now and it has impacted the global economy significantly. However, not all sectors of the economy were hit equally. In this article, we will have a look at which sectors within the Maltese economy were worst hit by the pandemic and those which weren’t hit or actually might have benefited from the pandemic.
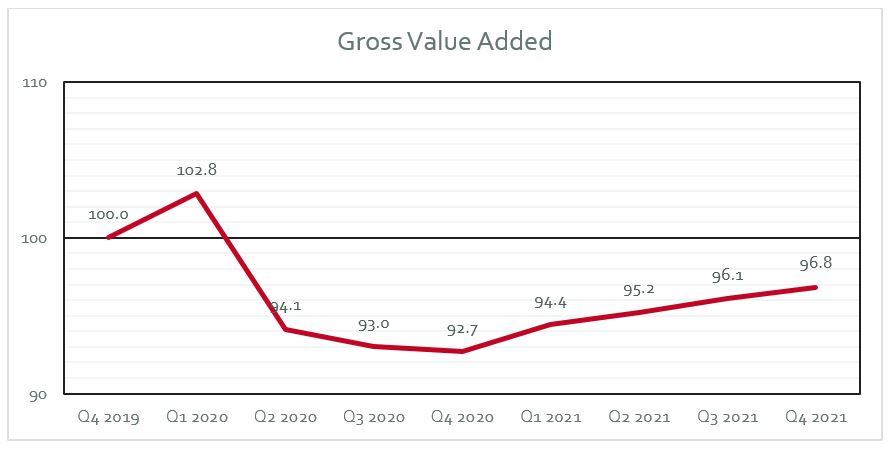
As a way of introduction for this analysis, Gross Value Added (GVA) figures for 2019 were used as the baseline. In 2019, total GVA[1] amounted to €11.6 Billion, while in 2020 and 2021, GVA amounted to €10.7 Billion and €11.7 Billion respectively. Here it is important to note that real GVA was taken into consideration to eliminate the impact of inflation which started to impact the economy in the latter part of 2021.
Taking 2019 as base year and hence equalling to an index of 100, the first quarter (Q1) of 2020 was slightly better than that registered in 2019, with a value of 102.8 or 2.8% higher as this quarter was only impacted by the pandemic in the last 3 week. However, there was a sharp drop in Q2 2022 and also a drop in the subsequent two quarters. By the end of the year the economy had lost 7.3% of its value added. In 2021, the economy started growing again, however, this growth was not enough to recover the losses in value added in 2020. As a result, during the past two years, 2020 and 2021, the economy lost 3.2% of what it would have generated if it stayed at the 2019 levels.
[1] GVA identity from the production (output) side in chain-linked volumes by period (reference year 2015)

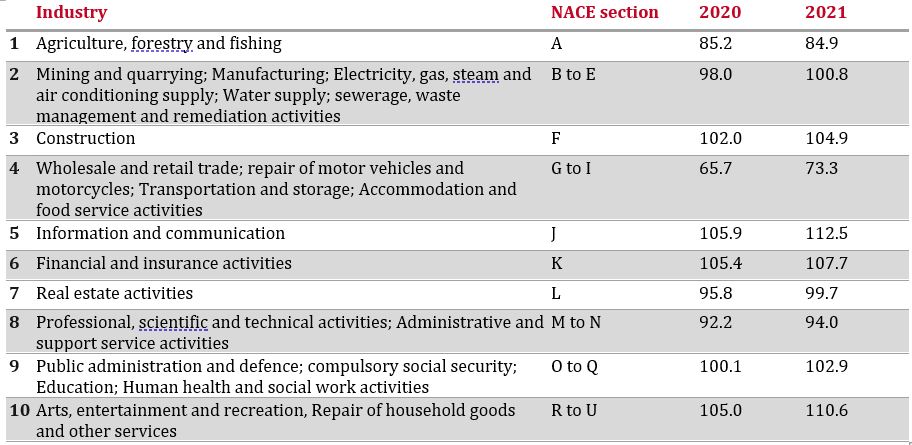
The economy is constructed by a number of different sectors, which the National statistics offices groups them into the below 10 main industries. The table below lists these ten industries (together with their grouping and NACE section) and gives a summary of their performance, which will be disused next.

When one looks at each sector individually, it is clear that industries were hit very differently. On one hand, the Information and communication sector increased by 12.5% while the fourth sector in the above table, which is closely linked to tourism, lost 26.7% of its value added in two years.
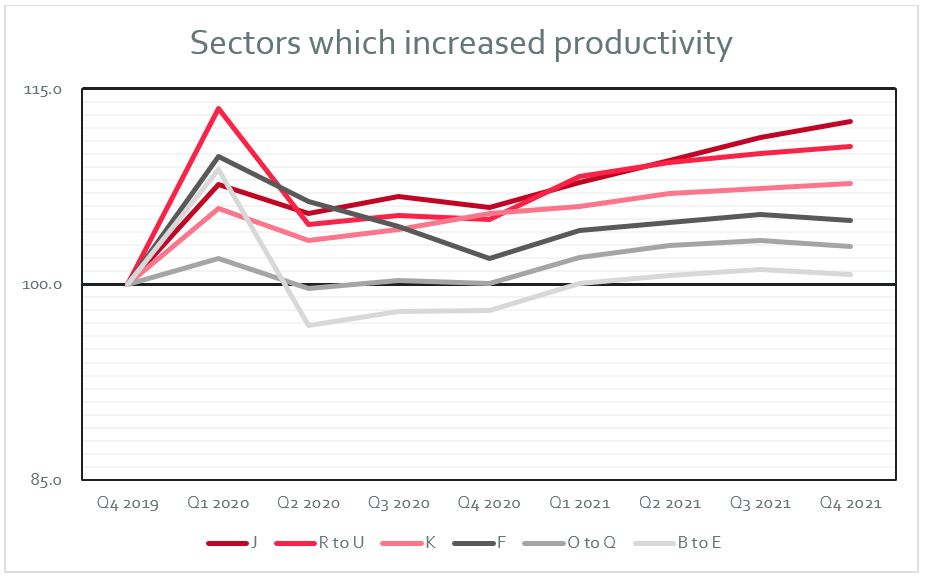
The graph below shows the 6 sectors which increased their productivity between 2020 and 2021 when compared to 2019. Furthermore, the quarterly analysis gives insights to the performance of these sectors and more important their trajectory. From the below, it is evident that as time passed during the past two years, growth in these six industries started to accelerate.

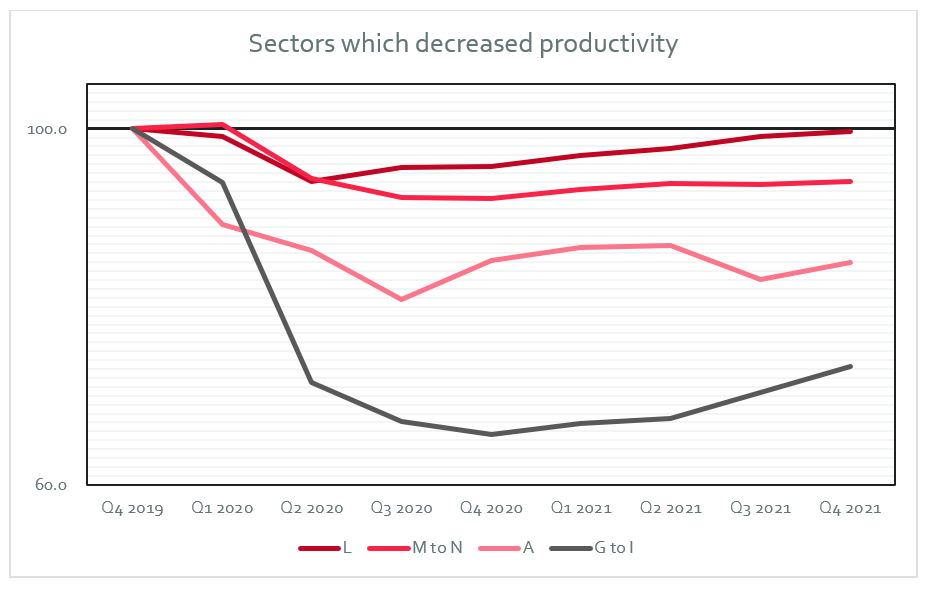
In comparison, the below four industries registered a decrease in productivity or value added when compared to 2019. Sector L (Real estate activities) is very close to the figures registered in 2019, similarly sectors M to N (Professional, scientific and technical activities; Administrative and support service activities), although these are still slightly off the 2019 levels. In contrast, sector A (Agriculture, forestry and fishing), which includes agricultural and fisheries products, and sectors G to I (Wholesale and retail trade; repair of motor vehicles and motorcycles; Transportation and storage; Accommodation and food service activities) are well off the figures registered in 2019, particularly sectors G to I as this is closely related to tourism. However, one can note that after Q4 2020 these sectors started to recover, although the road is still long when it comes to recovering what was lost.

To conclude, as seen in this analysis, collectively, with the growth registered in 2021, the economy recovered almost all losses incurred in 2020. However, not all sectors and industries were hit in the same way, and some are very far from having recovered what they lost in 2020. Therefore, there is still an argument for some aid that needs to be given to some sectors in order to help them recover some, if not all, of the losses incurred in 2020.
[1] GVA identity from the production (output) side in chain-linked volumes by period (reference year 2015)


