Europe 2020 – Indicators – Where does Malta stand?
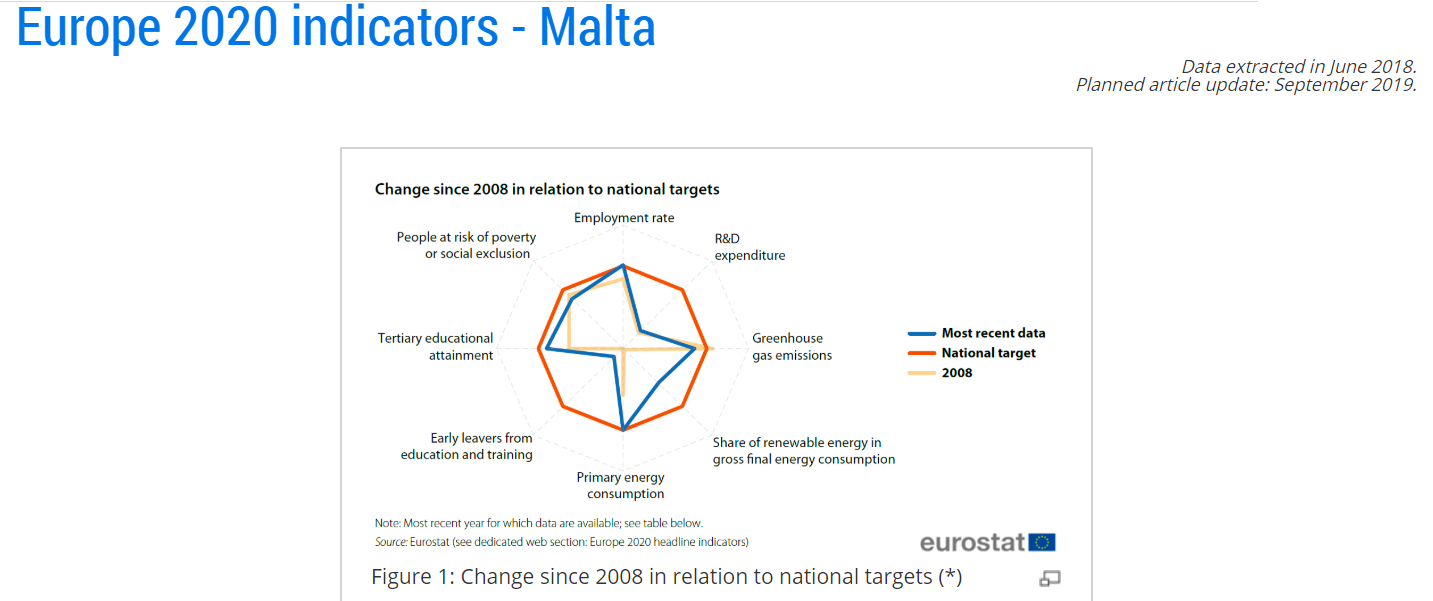
In September 2019 Eurostat published an update of the current national targets* of each Member State with the help of radar charts.
The charts show how far a country is from achieving its national targets, by comparing the national target (the red line), the country’s situation in 2008 (the yellow line) and the most recent situation (the blue line).
The distance between the blue line and the red line for a specific indicator shows how far a country currently is from its national target. Data points on or outside the red line mean the country has met or exceeded this target, while those inside show it still has some way to go.

Malta’s radar chart (above) shows that it is on target when it comes to ‘Employment Rate’ and close to target when it comes to ‘Tertiary Education’. A point worth noting is that the level of ‘People at risk of poverty’ registered in 2008 has remained practically the same and still short of the established national target. Meanwhile, Malta has registered improvement in its ‘Share of renewable energy’ which by end 2017 stood at 7.17% of the total final energy consumed but it is still far off from achieving the national target of 10%. Malta is also well below target and with no real improvement on its ‘R&D Expenditure’ since 2008, with only 0.54% of Malta’s GDP invested in R&D in 2017, with the target being of 2% of Malta’s GDP invested in R&D. Malta registered some improvement but remains far off from its target of reducing the share of early leavers from the education system. In 2017 17.5% left the education system at an early stage in Malta with the target being to reduce this to 10%.

If we take a look at the same radar chart for Cyprus and compare it to Malta, it is immediately evident that while Cyprus has still a long way to go in the sector of “People at risk of poverty” it has a much better performance when it comes to “R&D Expenditure”, “Early leavers from Education”, “Tertiary Education” and “Share of Renewable energy”.
NOTE: *Member States define their national targets in their National Reform Programmes (NRPs), taking into account their current situation. These programmes outline the actions and measures they plan to undertake to meet their national targets. The European Commission assesses each NRP and provides country-specific recommendations to support the programmes.
Indications of Accelerating Inflationary Pressures in Food Costs
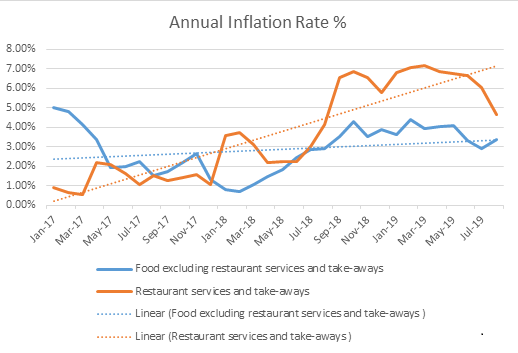
Since January 2017, the NSO started filtering the inflation stemming from Food costs, between those related to the actual food prices and those related to the cost of eating out at restaurants.
If one were to track the annual inflation rate from January 2017 to August 2019 with regards “Food excluding restaurant services and take-aways” and then “Restaurant services and take-aways”, one would see that the trendline that emerges is that while prices of Food on its own is increasing, the increase in prices for Restaurants and Take Away services was even more pronounced.
It would be interesting to understand is the reasons behind such a pronounced increase in prices for Restaurant and Take Away service. This could be due to the difficulty in recruiting staff and hence having to pay higher wages or due to the fact that with ever increasing inbound tourism, the demand for such services is high and hence restaurant owners have the luxury of increasing their prices.

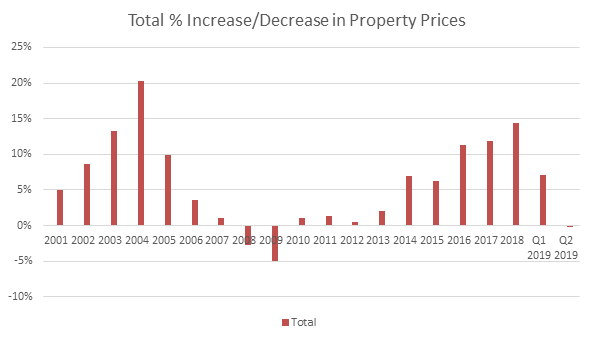
Could we be hitting the end of the double digit % increase in property prices?
The Property price Index issued by the Central Bank of Malta seems to indicate that the double digit % increase of property seen in recent years seems to be fading away in 2019.

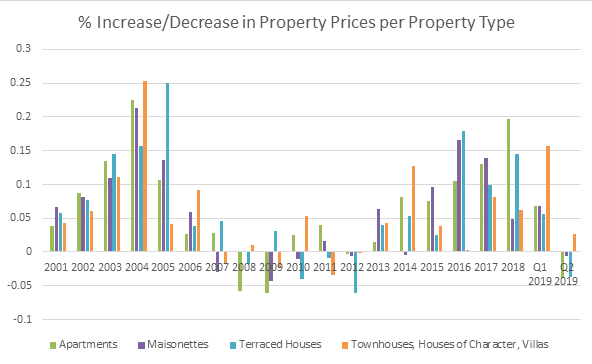
If one were to have a closer look at the % Increase & Decrease in Property prices, per Property type, one would see that the ever-increasing rate of apartment prices seen between 2013 – 2018, seems to be slowing down quite heavily in 2019. Apartment prices had an average annual increase in prices of 10% from 2013 to 2018, with the average increase registered in Q1 & Q2 2019 being of 1.47%.

TOP QUOTE


