Improvement in the “People at risk of poverty or social exclusion” statistic
In October 2019, Eurostat published the EU wide statistics on the “People at risk of poverty or social exclusion”. In 2018, Malta registered a rate of 19% which is an improvement from the 24.6% level registered in 2013. In quantity terms this meant a reduction from 102,000 persons in 2013 to 89,000 persons in 2018.
As can be seen below, in 2018 the Malta level of population at risk of poverty stood at 19% which is below the EU28 average of 21.7%.

Electricity Supply in Malta
Recent figures published indicate that Malta has been drastically reducing the electrical supply it bought from the interconnect with Sicily since 2017.

In 2018, the vast majority (69%) of the electricity supply in Malta came from the gas-powered power plants, with the rest (23%) coming from the interconnector. The remaining (almost 8%) came from renewable sources, with Malta’s national 2020 target for renewable sources being that of 10%.
Early leavers from Education and Training
Recently NSO issued a roundup of statistics related to the Labour Market between 2013 and 2018. Many of the statistics are good news, but one of them shows we still have a long way to go with youths. This is the rate of early leavers from education and training. In 2018 this stood at 17.4% whilst the rate in 2013 stood at 20.8% . However whilst this shows a steady decline over the years, it is still way higher than EU average of 10.6%.
With Malta experiencing problems to find skilled employees it is of vital importance that the authorities continue to undertake actions to reduce the number of early leavers from education. This is also extremely important if we are to really take our economy up the path of generating more value-adding activities which are dependent on a highly skilled workforce.

Never ending increase in the stock of licensed motor vehicles
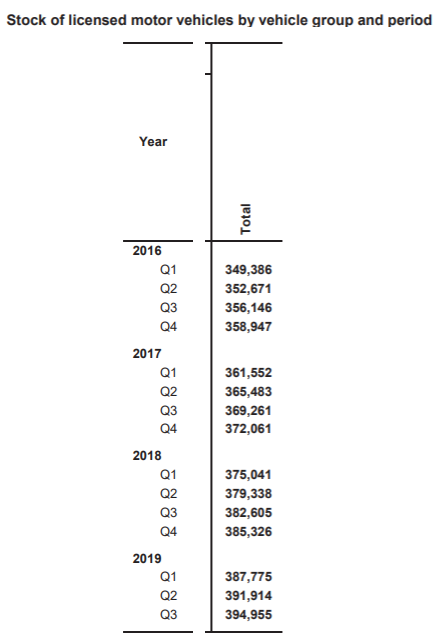
As can be seen below the net increase of licensed motor vehicles was 13,000 per annum in recent years (2016 – 2018). This means a net increase of around 36 licensed vehicles per day.
In 2019, we seem to be following the same trends as the net increase of licensed motor vehicles by end of Q3 2019 when compared to Q3 2018 was of 12,350 vehicles. This means that we shall likely surpass the 400,000 mark of licensed motor vehicles by Q1 2020.

It is interesting to note that if we are to focus on the stock of licensed private cars and divide that by the total amount of population, we would end up with the following results:-
| Year | Total Licensed Private Passenger Cars | Total Population | Amount of Private Cars per 1,000 inhabitants |
| 2014 | 257,990 | 439,691 | 587 |
| 2015 | 266,264 | 450,415 | 591 |
| 2016 | 273,246 | 460,297 | 594 |
| 2017 | 280,910 | 475,701 | 591 |
| 2018 | 288,062 | 493,559 | 584 |
This shows that in the years 2017 and 2018 the increase in population was higher than the increase in the amount of Licensed Private Passenger cars, meaning that foreign nationals settling in Malta were the more likely to use public transport.


